
With so much competition for social media visits and likes, everything I have read the last two years or listened to on podcasts is that marketing specialists should focus on great content. Obviously, no one wants to read boring and non-engaging content, so how do social media marketers make their content more interesting and engaging? A new trend that most marketers have been using are infographics. An infographic is a visual presentation of information in the form of a chart, graph, or other image accompanied by minimal text, intended to give an easily understood overview, often of a complex subject. Infographics are a great tool to help explain complex ideas, not only in social media because one can view the data in one quick and simple view. With readers being so busy these days, an infographic could help drive the main points of your content with your reader. I do not have experience posting infographics so I thought I would review two websites that help users create infographics, create an infographic, and discuss my experience. Performing a quick Google search, “free infographic” the first two websites appeared, Canva and Venngage.
The first infographic website I checked out was Canva, which I found by performing a simple Google search. After the signup, it had a demo video to show some of the tools and tips to make your infographic. I am pretty tech-savvy and I did not like this interface at all. Canva has plenty of free templates to choose from to help you get started but the editing of info and numbers was not really easy. It took 3 days for me to go back and forth and play around with the various templates, but I just got frustrated with it, and I never completed my infographic. Tired of working on this interface, I decided to try the other website for making infographics, Venngage. I did not like that the number values were fixed and you could not really edit the charts, not sure how it works in the premium version.
Pros:
- Easy signup process (Facebook or Gmail account)
- Quick video demo
- Comprehensive help section
- Tutorial challenges, which help you use the design features
- A wide variety of design types
Cons:
- Cannot adjust data for charts or graphs
- For infographics design type, free account limits features which makes creating infographic frustrating
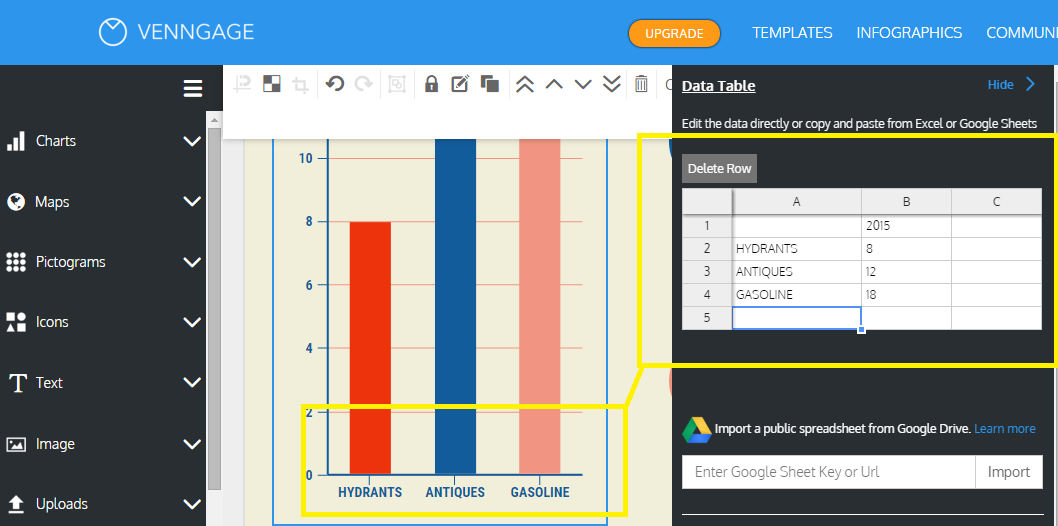
The next website I checked out to make my infographic was Venngage. I was able to jump right in and begin making my infographic. I liked the interface, really easy to choose what you want to make and start creating. I chose to make a simple infographic to try out the software and my infographic does not have a bunch of data, but this infographic I created took me 15 minutes from start to finish. Another great feature, which I really liked was that you easily edit graphs and charts in a data table format, and graph/chart adjusts to the new data. Simple and easy, Venngage will be my infographic website to publish future infographics.
Pros:
- Easy signup process (Facebook or Gmail account)
- With some help popup icons at setup, easy to start creating very quickly
- Comprehensive help section
- A wide variety of design types
Cons:
- In free account, can not download infographic only receive link
- For infographics design type, free account limits features which makes creating infographic frustrating
I really enjoyed using Venngage. Both websites are good for creating all kinds of design types but for purposes of designing infographics, I definitely preferred Venngage. I really liked the ability to change the data with the use of data tables, which made adjusting data very simple and quick to create. For my future creative infographics or other types, I will use Venngage; easy to create and the software is really simple to use.